Wednesday 22 April 2015

Opening Range Break-out Afl For Amibroker


Opening Range Break-out


_SECTION_BEGIN("OPENING RANGE BREAK-OUT");

uptrend=PDI()>MDI()AND Signal()<MACD();
downtrend=MDI()>PDI()AND Signal()>MACD();


Plot( 2, "ribbon",
IIf( uptrend, colorGreen, IIf( downtrend, colorRed, 0 )),
styleOwnScale|styleArea|styleNoLabel, -0.5, 100 );

_SECTION_END();

SetChartOptions(0,chartShowDates|chartShowArrows|chartLogarithmic|chartWrapTitle);
_SECTION_BEGIN("POS SIZE");
cap = Param("Capital", 0,100000, 5000000, 50000 );
risk = Param("Max. Risk",0.0025, 0.005, 0.02, 0.0025 );
_SECTION_END();

_SECTION_BEGIN("Volume");
Plot( Volume, "Volume", ParamColor("Color", colorLightGrey), styleNoTitle | ParamStyle( "Style", styleHistogram | styleOwnScale | styleThick | styleNoLabel, maskHistogram ), 5 );
_SECTION_END();
TrailStop = HHV( C - 2 * ATR(10), 15 );
Plot( TrailStop, "Trailing stop", colorCustom11, 8);
GfxSetOverlayMode(0);
GfxSelectFont("Tahoma", Status("pxheight")/15 );
GfxSetTextAlign( 6 );
GfxSetTextColor( ColorRGB( 200, 200, 200 ) );
GfxSetBkMode(3);
GfxTextOut( FullName(), Status("pxwidth")/2, Status("pxheight")/4 );

_SECTION_BEGIN("ORB");
tn = TimeNum();
dn = DateNum();
u = ValueWhen( tn<093000, HighestSince(dn!=Ref(dn,-1), H ));
w = ValueWhen( tn<093000, LowestSince(dn!=Ref(dn,-1), L ));
a= EMA(Close,5)-(EMA(ATR(1),10)*1.50) ;
b= EMA(Close,5)+(EMA(ATR(1),10)*1.50) ;
a1=(u-a)*RoundLotSize;
a2=((u-w))*RoundLotSize;
b1=(b-w)*RoundLotSize;
b2=((u-w))*RoundLotSize;

Longtgt=u+(u-w);
Shrttgt=w-(u-w);
//Plot(u,"Hgh", ParamColor("HighColor", colorRed), styleNoLine|styleDots);
//Plot(w,"low",ParamColor("HighLow", colorBlue),styleNoLine|styleDots);
//Plot(Longtgt,"",colorGreen,styleNoLine|styleDots);
//Plot(Shrttgt,"",colorGreen,styleNoLine|styleDots);
_SECTION_BEGIN("ORB POS SIZE");
cap1 = Param("Capital", 0,100000, 5000000, 50000 );
risk1 = Param("Max. Risk",0.0025, 0.005, 0.02, 0.0025 );
_SECTION_END();
_SECTION_BEGIN("GMMA");
a=C;
g=(EMA(Close,3) * (2 / 4 - 1)-EMA(Close,60) * (2 / 61 - 1)) / (2 /4- 2 /61);
e=Ref(g,-1);
Plot (EMA(a,3), "3ema", colorBlue,styleNoLabel);
Plot (EMA(a,5), "5ema", colorBlue,styleNoLabel);
Plot (EMA(a,8), "8ema", colorBlue,styleNoLabel);
Plot (EMA(a,10), "10ema", colorBlue,styleNoLabel);
Plot (EMA(a,12), "12ema", colorBlue,styleNoLabel);
Plot (EMA(a,15), "15ema", colorBlue);

Plot (EMA(a,30), "30ema", colorRed,styleNoLabel);
Plot (EMA(a,35), "35ema", colorRed,styleNoLabel);
Plot (EMA(a,40), "40ema", colorRed,styleNoLabel);
Plot (EMA(a,45), "45ema", colorRed,styleNoLabel);
Plot (EMA(a,50), "50ema", colorRed,styleNoLabel);
Plot (EMA(a,55), "55ema", colorRed,styleNoLabel);
Plot (EMA(a,60), "60ema", colorRed);
Plot(C,"close", colorBlack,styleCandle);

Cond1=StochK(14)>StochD(14);
Cond2=StochK(14)<StochD(14);

Buy=Cross(C, u);

Sell=Cross( w,C);

Filter = Buy OR Sell;

_SECTION_END();
AddColumn( IIf( Buy, 66, 83 ), "Signal", formatChar );
AddColumn(Close,"Close",1.2);
AddColumn(Volume,"Volume",1.0);
Cond13=PDI()>MDI();

_SECTION_END();

_SECTION_END();
Title = Date()+"  "+ Interval(format=2)+"  "+Name()+" "+"O "+WriteVal(O)+" "+"H "+WriteVal(H)+"  L"+WriteVal(L)+"    C "+WriteVal(C)+EncodeColor(colorRed)+" Lot Size  "+WriteVal(RoundLotSize,1.0)+"  Margin"+WriteVal(MarginDeposit,1.0)+
"\n"+EncodeColor(colorBlack)+"ORB TRADE"+"\n"+EncodeColor(colorGreen)+"  Buy above  "+WriteVal(u,1.2)+" Target   "+ WriteVal(Longtgt,1.2)+"\n"+EncodeColor(colorRed)+"  Sell below  "+WriteVal(w,1.2)+" target  "+ WriteVal(Shrttgt,1.2)+
"\n"+EncodeColor(colorBlue)+" Trade risk based on ORB Rs "+ WriteVal((u-w),1.2)+ "  Position Size based on " + WriteVal(risk1*100,1.2)+ " % risk = " + WriteVal((cap1*risk1)/(u-w),1.0)+ "shares"+"\n"+ EncodeColor(colorGreen)+"  ADX is "+ WriteIf(Cond13,"BULLISH","BEARISH ");
 _SECTION_BEGIN("my FIST");

tn = TimeNum();
dn = DateNum();
u = ValueWhen( tn<093000, HighestSince(dn!=Ref(dn,-1), H ));
w = ValueWhen( tn<093000, LowestSince(dn!=Ref(dn,-1), L ));
Buy=Cross(C,u) ;
Sell=Cross(w,C);
shape = Buy * shapeUpArrow + Sell * shapeDownArrow;

PlotShapes( shape, IIf( Buy, colorBlue, colorRed ),0, IIf( Buy, Low, High ) );

GraphXSpace = 5;
dist = 5*ATR(10);

for( i = 0; i < BarCount; i++ )
{
if( Buy[i] ) PlotText( "ORBuy\n@" + u[ i ], i, L[ i ]-dist[i], colorBlue
);
if( Sell[i] ) PlotText( "ORSell\n@" + w[ i ], i, H[ i ]+dist[i],
colorBlue);
}
Plot( 1, "", IIf(EMA(C,15)>EMA(C,60) , colorPaleGreen, colorRose ),styleArea | styleOwnScale, 0, 1 );
_SECTION_END();
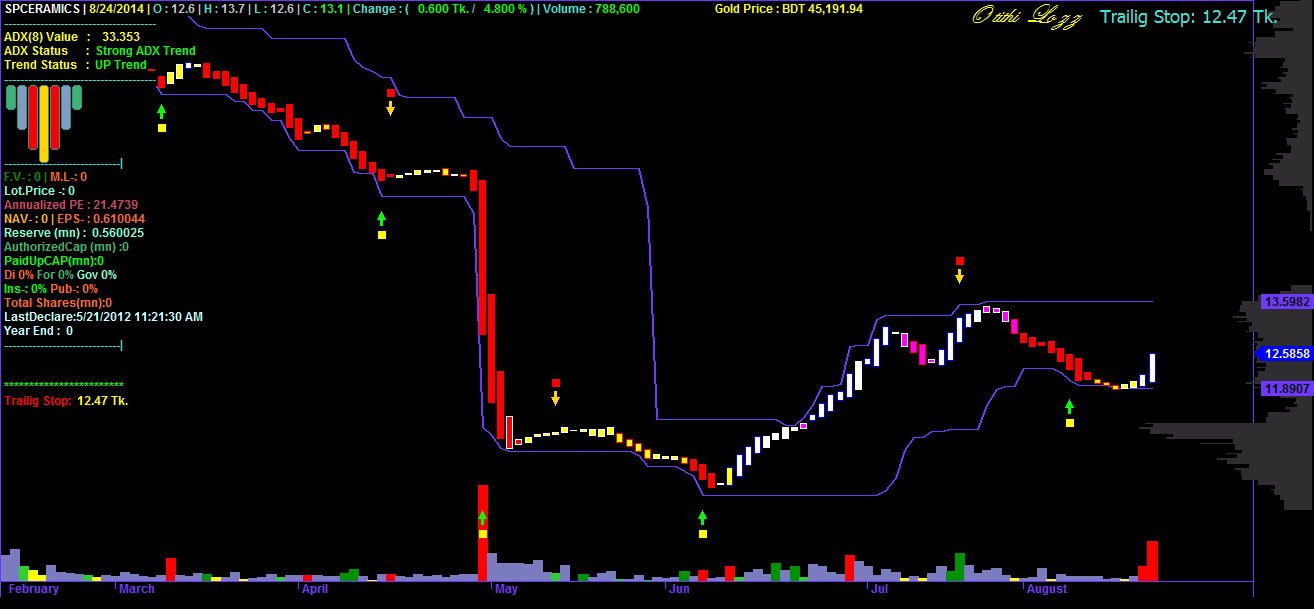
Monday 20 April 2015

N line break for Amibroker (AFL)


N line break for Amibroker (AFL)


procedure constructChart_proc(nBar)
{
    global lBeginTime;
    global lEndTime;
    global lBeginNoTime;
    global lEndNoTime;
    global j;

    lBeginTime[ 0 ] = C[ 0 ];
    lEndTime[ 0 ] = C[ 0 ];
    lBeginNoTime[ 0 ] = C[ 0 ];
    lEndNoTime[ 0 ] = C[ 0 ];  
    lastHigh = C[ 0 ];
    lastLow = C[ 0 ];
    numUp = 0;
    numDn = 0;
    j = 0;

    for ( i = 1; i < BarCount; i++ )
    {
        // 1) trend change up
        if ( C[ i ] > lastHigh AND numDn >= nBar AND numUp == 0)
        {
            numDn = 0;
            numUp = numUp + 1;
            j = j + 1;

            lBeginTime[ i ] = lBeginTime[ i - 1];
            lEndTime[ i ] = C[ i ];
          
            lBeginNoTime[ j ] = lBeginNoTime[ j - 1];
            lEndNoTime[ j ] = C[ i ];      

            lastLow = lEndNoTime[ j - 1 ];
            lastHigh = C[ i ];
        }
        // 2) trend up continuation after downbar
        else if ( C[ i ] > lastHigh AND numDn > 0 AND numDn < nBar AND numUp == 0)
        {
            numDn = 0;
            numUp = numUp + 1;
            j = j + 1;

            lBeginTime[ i ] = lBeginTime[ i - 1];
            lEndTime[ i ] = C[ i ];
          
            lBeginNoTime[ j ] = lBeginNoTime[ j - 1];
            lEndNoTime[ j ] = C[ i ];      

            lastLow = lEndNoTime[ j - 1 ];
            lastHigh = C[ i ];          
        }      
        // 3) trend up continuation
        else if ( C[ i ] > lastHigh AND numDn == 0 )
        {
            numDn = 0;
            numUp = numUp + 1;
            j = j + 1;
          
            lBeginTime[ i ] = lEndTime[ i - 1];
            lEndTime[ i ] = C[ i ];
          
            lBeginNoTime[ j ] = lEndNoTime[ j - 1];
            lEndNoTime[ j ] = C[ i ];      
                  
            if (numUp >= nbar)
            {
                lastLow = lEndNoTime[ j - nBar ];
            }
            else if (numUp < nBar)
            {
                lastLow = lastLow;
            }
            lastHigh = C[ i ];
        }  
         // 1) trend change down
        else if ( C[ i ] < lastLow AND numUp >= nBar AND numDn == 0)
        {
            numUp = 0;
            numDn = numDn + 1;
            j = j + 1;

            lBeginTime[ i ] = lBeginTime[ i - 1];
            lEndTime[ i ] = C[ i ];
          
            lBeginNoTime[ j ] = lBeginNoTime[ j - 1];
            lEndNoTime[ j ] = C[ i ];      

            lastLow = C[ i ];
            lastHigh = lEndNoTime[ j - 1 ];                      
        }  
        // 2) trend down continuation after upbar
        else if ( C[ i ] < lastLow AND numUp > 0 AND numUp < nBar AND numDn == 0)
        {
            numUp = 0;
            numDn = numDn + 1;
            j = j + 1;

            lBeginTime[ i ] = lBeginTime[ i - 1];
            lEndTime[ i ] = C[ i ];

            lBeginNoTime[ j ] = lBeginNoTime[ j - 1];
            lEndNoTime[ j ] = C[ i ];      

            lastLow = C[ i ];
            lastHigh = lEndNoTime[ j - 1 ];                  
        }  
        // 3) trend down continuation
        else if ( C[ i ] < lastLow AND numUp == 0 )
        {
            numUp = 0;
            numDn = numDn + 1;
            j = j + 1;
          
            lBeginTime[ i ] = lEndTime[ i - 1];
            lEndTime[ i ] = C[ i ];
          
            lBeginNoTime[ j ] = lEndNoTime[ j - 1];
            lEndNoTime[ j ] = C[ i ];                  
          
            if (numDn >= nbar)
            {
                lastHigh = lEndNoTime[ j - nBar ];
            }
            else if (numDn < nBar)
            {
                lastHigh = lastHigh;
            }
            lastLow = C[ i ];
        }  
        // no break
        else if ( C[ i ] >= lastLow AND C[ i ] <= lastHigh )
        {
            lBeginTime[ i ] = lBeginTime[ i - 1];
            lEndTime[ i ] = lEndTime[ i - 1 ];
        }  
    }
}


SetBarsRequired( sbrAll, sbrAll );

nBar = Param( "nBar", 3, 2, 10, 1 );
constructChart_proc(nBar);

Title = Name() +
" |  " + EncodeColor( colorYellow ) + nbar + EncodeColor( colorWhite ) + " Line Break";

chartType = ParamToggle("Show Time Axis","show|hide",0);
if (chartType)
{
    GraphXSpace = 5;
    SetChartOptions( 0, chartShowDates );
    Plot(C, "\nTLB", colorWhite, styleBar);
    C = lEndTime;
    O = lBeginTime;
    H = IIf( C > O, C, O );
    L = IIf( C > O, O, C );
    Plot(C,"", colorWhite, styleCandle);
}
else
{
    delta = BarCount - 1 - j;
    lBeginNoTime = Ref(lBeginNoTime,-delta);
    lEndNoTime = Ref(lEndNoTime,-delta);
    C = lEndNoTime;
    O = lBeginNoTime;
    H = IIf( C > O, C, O );
    L = IIf( C > O, O, C );
    Plot(C,"\nTLB", colorWhite, styleCandle);
}

Fishnet with rainbow colors Afl for Amibroker

Fishnet with rainbow colors


_SECTION_BEGIN("");
Plot( C, "Close", ParamColor("Color", colorWhite), styleNoTitle | ParamStyle("Style", styleCandle, maskPrice ) );

net= 30;


for (i=1; i<net;i++) {

Plot(MA(Close,i),"",colorDarkRed,styleLine);

}

for (i=net; i<2*net;i++) {

Plot(MA(Close,i),"",colorOrange,styleLine);

}

for (i=2*net; i<3*net;i++) {

Plot(MA(Close,i),"",colorGold,styleLine);

}

for (i=3*net; i<4*net;i++) {

Plot(MA(Close,i),"",colorLime,styleLine);

}

for (i=4*net; i<5*net;i++) {

Plot(MA(Close,i),"",colorBlue,styleLine);

}

for (i=5*net; i<6*net;i++) {

Plot(MA(Close,i),"",colorIndigo,styleLine);

}

for (i=6*net; i<7*net;i++) {

Plot(MA(Close,i),"",colorViolet,styleLine);

}


_SECTION_END();

Triangular Moving average AFL For amibroker

Triangular Moving average AFL For amibroker


Odd=13;
CoefOdd=round(Odd/2);

Even=12;
Coefeven=Even/2;
Coefeven2=Coefeven+1;

CongestionPercent=2.8;

TriangularOdd=MA(MA(C,CoefOdd),CoefOdd);
TriangularEven=MA(MA(C,Coefeven),Coefeven2);

finalMov_avg=IIf(Odd > even,triangularOdd,TriangularEven);

Color=colorBrightGreen;
tickercolor=colorWhite;

Plot(finalMov_avg,"",IIf(C < finalmov_avg,colorRed,Color),styleLine|styleThick);
Plot(C,"",tickercolor,styleCandle);

Title=Name()+"..."+"( "+WriteIf(Odd > even,WriteVal(Odd,1),WriteVal(even,1))+" ) Period "+EncodeColor(Color)+"Triangular"+WriteIf(Odd > even,"ODD","EVEN")+" Moving Average"+"..."+EncodeColor(colorBlack)+ WriteIf(C < finalMov_avg,"Close is "+EncodeColor(colorRed)+"Below"+EncodeColor(colorBlack)+" Moving Average by ","Close is"+EncodeColor(colorBrightGreen)+" Above"+EncodeColor(colorBlack)+" Moving Average by ")+"("+WriteVal(((C/finalMov_avg)-1)*100,1.1)+"% )"+"\n"+WriteIf(finalmov_avg-Ref(finalmov_avg,-1)>0," Slope Of Average is UP : ","Slope Of Average is DOWN :")+WriteIf((((C/finalMov_avg)-1)*100 <= CongestionPercent AND ((C/finalMov_avg)-1)*100 >= -CongestionPercent),EncodeColor(colorYellow)+" with Price Congestion / Divergence to Average ","")+"\n"+WriteIf(Ref(C,-1) < Ref(finalmov_avg,-1) AND C > finalmov_avg,EncodeColor(colorGreen)+"Possible Change in Trend From Down to Up"+"\n"+" OR Short Term Correction of Previous Trend",WriteIf(Ref(C,-1) > Ref(finalmov_avg,-1) AND C < finalmov_avg,EncodeColor(colorRed)+"Possible Change in Trend From Up to Down "+"\n"+" OR Short Term Correction to Previous Trend",""))+"\n"+WriteIf(C > finalmov_avg,EncodeColor(colorGreen)+"Close has been above Moving Average ( "+WriteVal(BarsSince(C < finalmov_avg),1)+" ) Bars",EncodeColor(colorRed)+"Close has been Below Moving Average ( "+WriteVal(BarsSince(C > finalmov_avg),1)+" ) Bars")+"\n"+EncodeColor(colorBlack)+"The average # of Bars Above ( "+WriteVal(round(Cum(BarsSince(C < finalmov_avg)/Cum(1))),1)+" )"+"\n"+"The average # of Bars Below ( "+WriteVal(round(Cum(BarsSince(C > finalmov_avg)/Cum(1))),1)+" )";
_SECTION_BEGIN("AFL Example");


SetBarsRequired(10000,10000); /* this ensures that the charts include all bars AND NOT just those on screen */
SetFormulaName("Sample System"); /*name it for backtest report identification */
SetTradeDelays( 1, 1, 1, 1 ); /* delay entry/exit by one bar */
SetOption( "initialequity", 100000 ); /* starting capital */
PositionSize = -10; /* trade size will be 10% of available equty */
SetOption( "MaxOpenPositions", 6 ); /* I don't want to comit more than 60% of Equity at any one time */
SetOption( "PriceBoundChecking", 1 ); /* trade only within the chart bar's price range */
SetOption( "CommissionMode", 2 ); /* set commissions AND costs as $ per trade */
SetOption( "CommissionAmount", 32.95 ); /* commissions AND cost */
SetOption( "UsePrevBarEquityForPosSizing", 1 ); /*set the use of last bars equity for trade size*/
PositionScore = 100/C; /*Set the order for which stock trades when get mulitple signals in one bar in backtesting */


LongPer = Param("Long Period", 50, 30, 100, 5 ); /* select periods with parameter window */
ShortPer = Param("Short Period", 5, 3, 10, 1 );

LongMA = EMA( C, LongPer );
ShortMA = EMA( C, ShortPer );
LastHigh = HHV( H, LongPer );

Buy = Cross( ShortMA, LongMA ) AND H > Ref( LastHigh, -1 );

Sell = Cross( LongMA, ShortMA );

Buy = ExRem(Buy,Sell);
Sell = ExRem(Sell,Buy);


Filter = Buy OR Sell;
AddTextColumn( FullName(), "Company Name" );
AddColumn( Buy, "Buy", 1 );
AddColumn( Sell, "Sell", 1 );
AddColumn( C, "Close", 1.3 );
AddColumn( H, "High", 1.3 );
AddColumn( LastHigh, "HHV", 1.3 );
AddColumn( LongMA, "Long MA", 1,3 );
AddColumn( ShortMA, "Short MA", 1,3 );


GraphXSpace = 10;

//Plot( C, " Close Price", colorGrey50, styleBar );
Plot( LongMA, " EMA(C,"+WriteVal(LongPer,1)+")", colorBrown, styleLine|styleNoRescale );
Plot( ShortMA, " EMA(C,"+WriteVal(ShortPer,1)+")", colorBlue, styleLine|styleNoRescale );
Plot( Ref(Lasthigh,-1), " HHV(H,"+WriteVal(LongPer,1)+")", colorRed, styleNoLine|styleDots|styleNoRescale );

PlotShapes( shapeUpArrow*Buy, colorGreen, 0, L, -10 );
PlotShapes( shapeDownArrow*Sell, colorRed, 0, H, -10 );

Title = " {{NAME}} {{DATE}} {{INTERVAL}} "+_DEFAULT_NAME()+" Chart values : {{VALUES}} ";


_SECTION_END();